WoAtlas.com
Country Comparison

vs

Key Statistics


Population Density
597.4 /km²
34.6 /km²
Health
Economy & Environment
Agriculture (% of GDP)
N/A
1.0%
Industry (% of GDP)
N/A
17.9%
Services (% of GDP)
N/A
77.6%
Exports (% of GDP)
55.3%
11.1%
Imports (% of GDP)
110.5%
14.3%
Education & Society
Technology & Infrastructure
Population Pyramids
Nauru

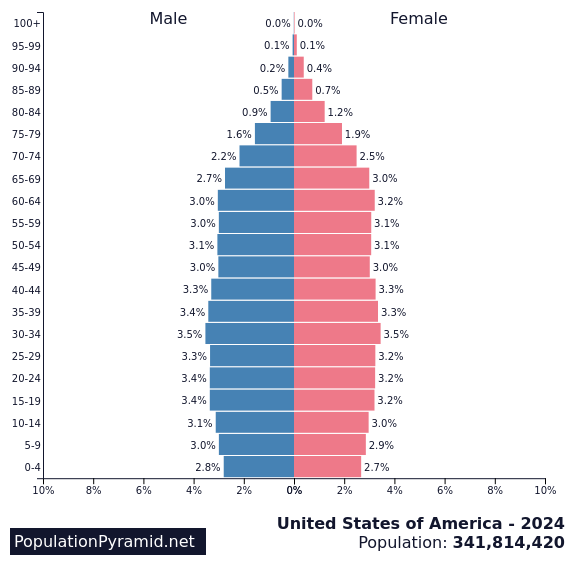
United States