Country Comparison

vs

Key Statistics

Population
7.4M 106th
340.1M 3rd
GDP
$48.5B 98th
$28.8T 1st
GDP per Capita
$6,569 125th
$84,534 12th
GNI per Capita (PPP)
$15,400 116th
$85,980 10th
GDP Growth
1.9% 149th
2.8% 122nd
Surface Area
1,759,540 km² 16th
9,831,510 km² 3rd
Population Density
4.2 /km²
34.6 /km²
Fertility Rate (births/woman)
2.4 83rd
1.6 135th
Urban Population
87.9% 40th
80.1% 57th
Population 65+
5.0% 146th
17.9% 45th

Health

Life Expectancy
69.3 yrs 156th
78.4 yrs 63rd
Infant Mortality (per 1,000)
15.9 114th
5.5 56th
Maternal Mortality (per 100k)
59.0 107th
17.0 67th
Health Spending per Capita
$470 98th
$13,473 1st
Health Spending (% of GDP)
7.8% 66th
16.7% 3rd
Physicians (per 1,000)
2.04 86th
3.68 39th
Hospital Beds (per 1,000)
3.50 56th
2.68 82nd

Economy & Environment

Unemployment Rate
19.1% 180th
4.0% 71st
GHG Emissions (tons/capita)
15.43 168th
17.74 175th
Agriculture (% of GDP)
2.4%
1.0%
Industry (% of GDP)
73.5%
17.9%
Services (% of GDP)
28.3%
77.6%
Exports (% of GDP)
72.0%
11.1%
Imports (% of GDP)
56.8%
14.3%

Education & Society

Literacy Rate
N/A
N/A
Education Spending (% GDP)
2.3% 175th
5.4% 44th
Gini Index
N/A
41.8 134th
Poverty Rate ($2.15/day)
N/A
1.2% 68th
Homicide Rate (per 100K)
N/A
5.8 134th
Women in Parliament
16.5% 144th
28.7% 76th
Female Labor Participation
33.3% 163rd
56.6% 73rd
Military Spending (% GDP)
5.3% 12th
3.4% 24th

Technology & Infrastructure
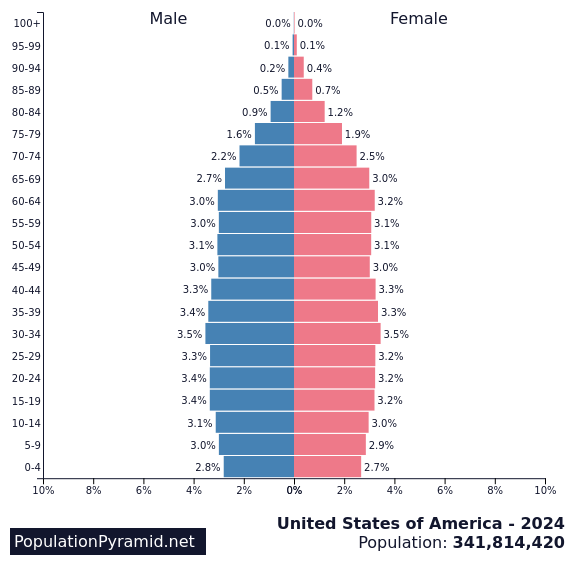
Internet Users
88.5% 67th
93.1% 42nd
Mobile Subscriptions (per 100)
193.0 6th
112.4 111th
Access to Electricity
73.2% 175th
100.0% 124th
Access to Water
96.4% 116th
100.0% 44th
Access to Sanitation
88.5% 131st
99.6% 34th
Renewable Energy
3.1% 173rd
10.9% 143rd
Forest Area (% of land)
0.1% 206th
33.9% 96th

Population Pyramids

Libya

Population pyramid of Libya

United States

Population pyramid of United States

GDP Composition

Libya

United States

Trade Balance (% of GDP)

Libya

United States

Population Over Time

Libya

United States

GDP Over Time

Libya

United States

Life Expectancy Over Time

Libya

United States